Free Four Column Chart PDF Form
Misconceptions
The Four Column Chart form is a useful tool for organizing information, but there are several misconceptions surrounding its use. Below is a list of common misunderstandings.
- It is only for business use. Many believe that the Four Column Chart is solely for business applications. In reality, it can be utilized in various contexts, including education, personal projects, and community planning.
- It requires advanced skills to fill out. Some think that completing the chart requires specialized knowledge or skills. In fact, anyone can use it effectively with basic organizational abilities.
- All columns must be filled completely. There is a misconception that each column must be filled to the brim. While detailed information is helpful, it is acceptable to leave some columns less populated if necessary.
- It is only effective for specific topics. Some people believe the chart is limited to certain subjects. However, it can be adapted to a wide range of topics, making it versatile.
- The format is rigid and unchangeable. Many think that the Four Column Chart must adhere to a strict format. In truth, users can modify the headings and structure to better suit their needs.
- It is not useful for collaborative efforts. Some believe the chart is ineffective for teamwork. On the contrary, it can facilitate group discussions and help organize collective ideas.
- It is outdated and no longer relevant. There is a notion that this method of organization is obsolete. However, the Four Column Chart remains a practical tool for many today.
Understanding these misconceptions can help individuals make better use of the Four Column Chart in various settings.
What to Know About This Form
What is the purpose of the Four Column Chart form?
The Four Column Chart form is designed to help organize information clearly and effectively. It allows users to categorize details under specific headings, making it easier to analyze and present data. This format is particularly useful for comparing different aspects of a topic or project.
How do I fill out the Four Column Chart form?
To fill out the form, start by writing the topic at the top. Then, create headings for each of the four columns. Each column should represent a different category or aspect of the topic. After you have your headings, add relevant details under each column. Ensure that the information is concise and directly related to the headings.
Can I use the Four Column Chart form for any topic?
Yes, the Four Column Chart form is versatile and can be used for a wide range of topics. Whether you are working on a project, preparing a report, or conducting research, this chart can help you organize your thoughts and findings effectively.
Is there a specific format I need to follow when creating headings?
There is no strict format for the headings. However, it is best to keep them clear and descriptive. This way, anyone reviewing the chart will quickly understand what each column represents. Aim for simplicity and clarity to enhance communication.
What if I need more than four columns?
If you find that you need more than four columns, consider whether the additional information can be grouped under existing headings. If not, you may create a separate chart or use a different format that allows for more columns. The goal is to maintain clarity and organization.
Can I share my completed Four Column Chart with others?
Absolutely! Once you have filled out the Four Column Chart, feel free to share it with colleagues, classmates, or anyone else who may benefit from the information. Sharing can promote collaboration and enhance understanding of the topic.
Different PDF Forms
Free 1099-nec Form - Penalties may arise if you submit a non-scannable version of Copy A to the IRS.
When completing a vehicle transaction in California, it's crucial to utilize the appropriate documentation to ensure legal compliance and clarity. The California Motor Vehicle Bill of Sale form is an indispensable resource in this process, and for those seeking a reliable template, Fast PDF Templates offers a convenient solution to facilitate the transfer of ownership seamlessly.
Navpers 1336 3 - Routing the form through the correct channels ensures organized handling of requests.
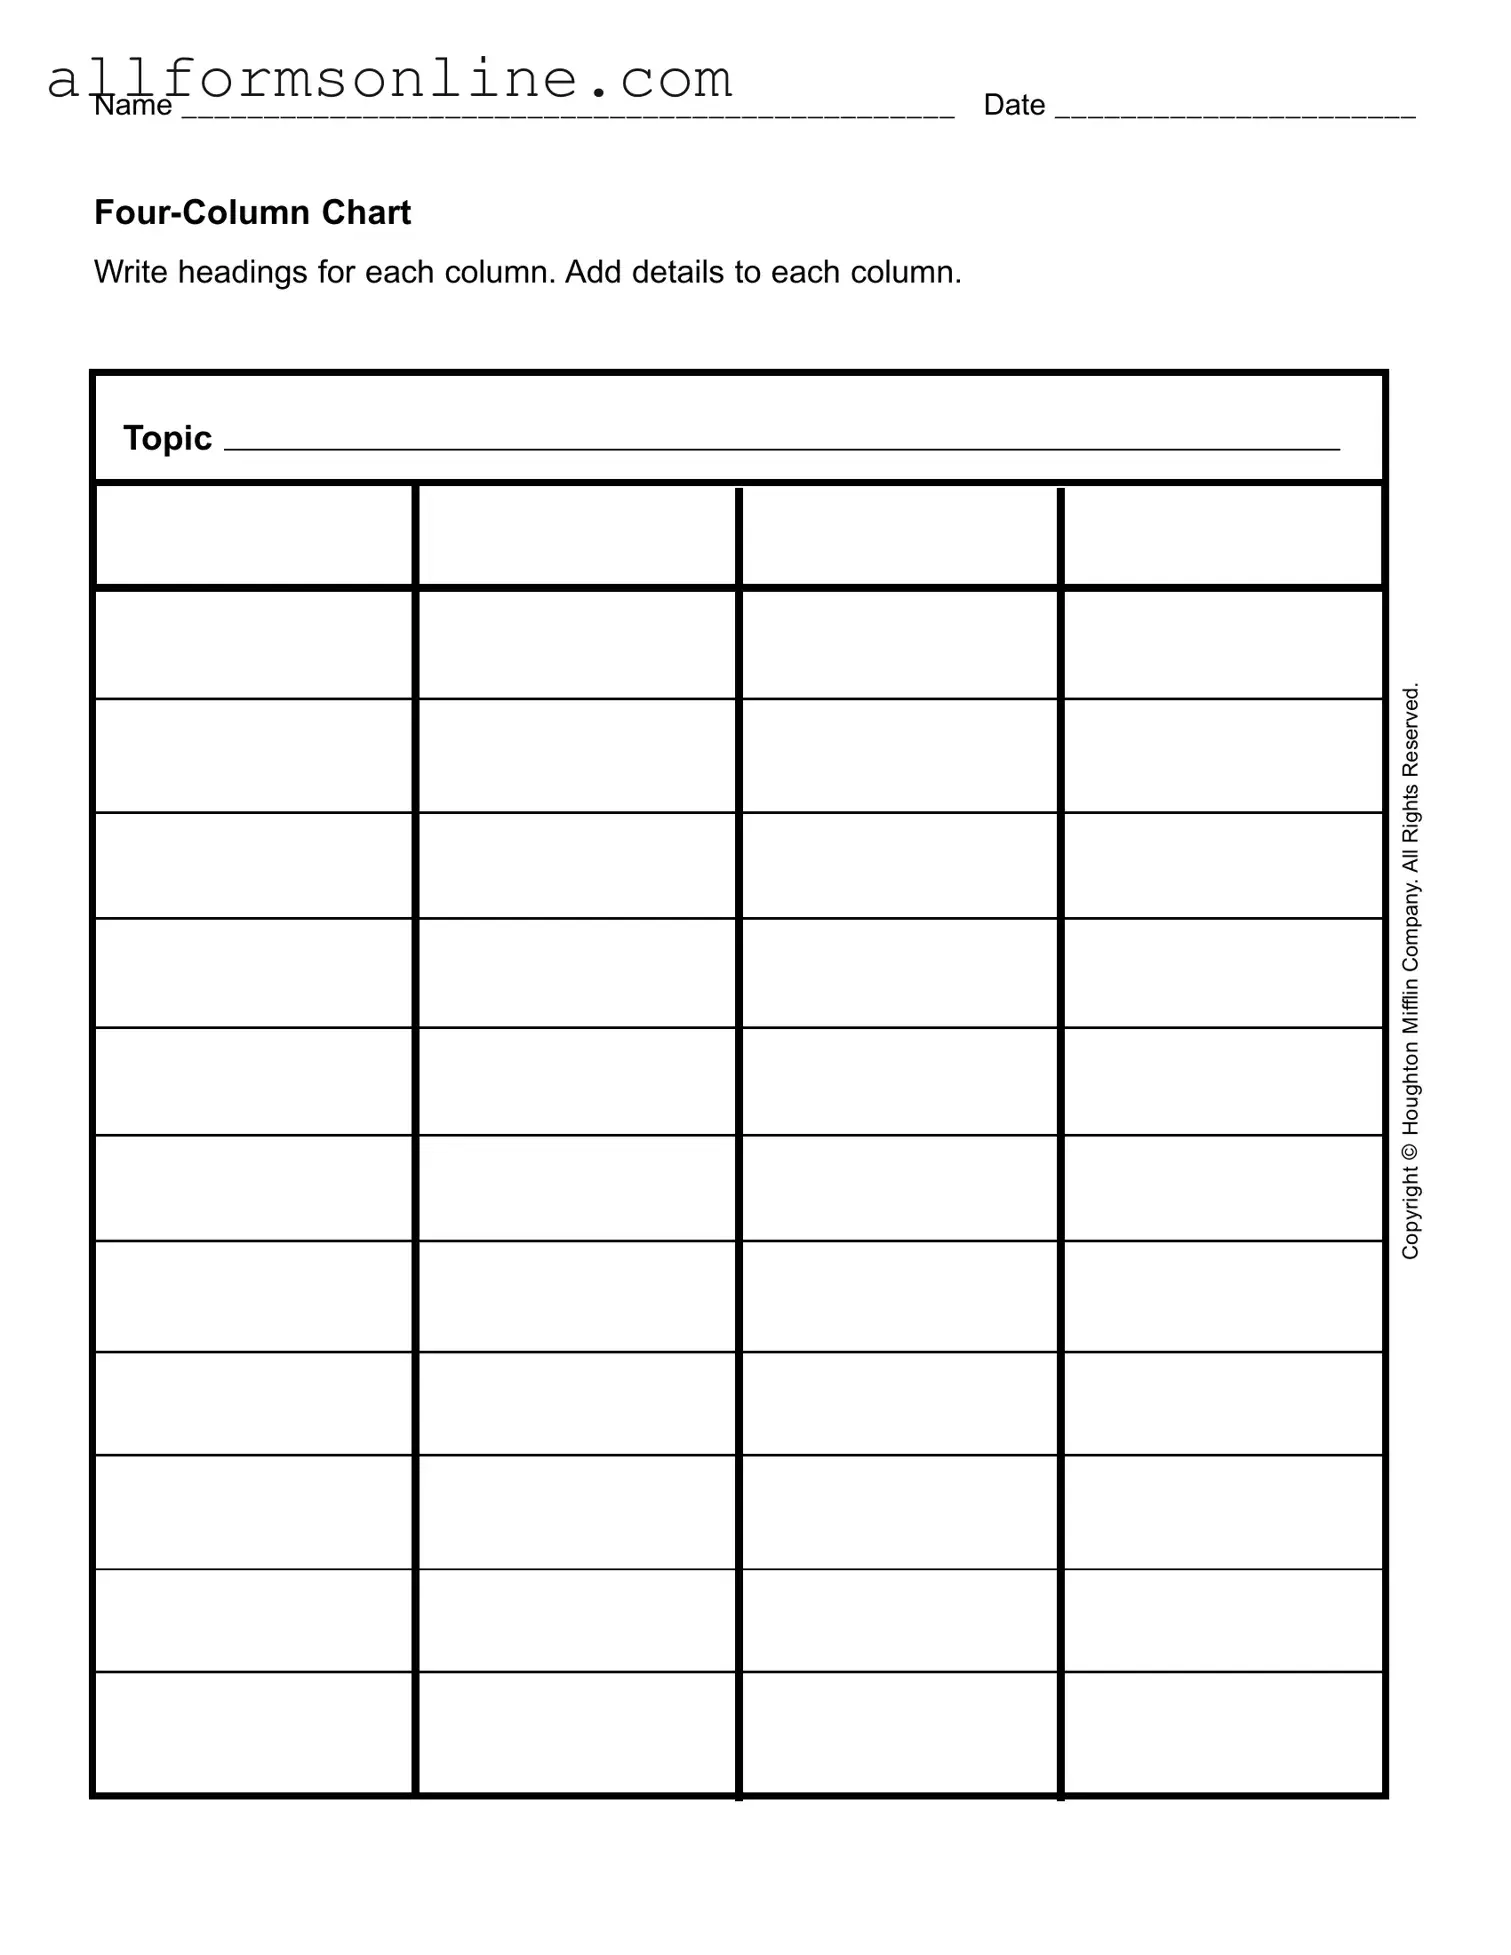
How to Use Four Column Chart
Filling out the Four Column Chart form requires careful attention to detail. Each section serves a specific purpose, and organizing your information clearly will enhance your understanding of the topic at hand. Follow these steps to complete the form effectively.
- Begin by writing your Name in the designated space at the top of the form.
- Next, fill in the Date on the line provided, ensuring the format is clear and legible.
- In the first column, write a heading that summarizes the main topic you will be discussing.
- For the second column, create a heading that represents the first aspect or detail related to your topic.
- In the third column, add a heading for another aspect or detail that complements the first.
- Finally, in the fourth column, write a heading for the last aspect or detail that rounds out your discussion.
- Once the headings are established, fill in each column with relevant details that align with the headings you have created.
After completing the form, review your entries for clarity and completeness. This will ensure that the information is presented in a logical and coherent manner.